Table of Contents
- What Is AI-Powered Weekly Report Automation?
- What Parts of a Weekly Report Can Be Automated?
- How to Automate a Weekly Report With AI
- Complete Example (Fictional Data)
- 3 Ways to Automate Weekly Reports
- Manual vs. Automated Weekly Reports
- Types of Weekly Reports You Can Automate
- How to Prevent AI Reporting Errors
- When You Should NOT Automate a Weekly Report
- Common Mistakes When Automating Weekly Reports
- How to Measure Success
- Conclusion
Every week, the same reporting task shows up: open multiple tools, pull numbers into a spreadsheet, compare them with last week's results, figure out what changed, and turn everything into a summary that someone can actually understand. The report may take an hour to write, but the real cost is the time your team spends assembling information instead of acting on it. AI can change that process-but not by simply asking a chatbot to “write this week's report.”
The more reliable approach is to combine automation and AI. Automation collects the right data, calculates the metrics, and runs the workflow on schedule. AI then helps identify important changes, explain the numbers in plain language, and draft the report. A person reviews the result, adds context, and approves it before it reaches the team. That combination can turn a repetitive weekly reporting chore into a process that takes minutes to review instead of hours to build.
In this guide, you'll learn how to automate a weekly report from start to finish, which parts should be handled by automation versus AI, how to structure the data, how to prevent common reporting errors, and how to build a workflow you can actually trust week after week.
What Is AI-Powered Weekly Report Automation?

AI-powered weekly report automation is a workflow where scheduled automation pulls data from your existing tools, and an AI system analyzes that data and drafts a written summary, instead of a person manually compiling and writing the report each week.
The automation layer handles the mechanical parts: connecting to a spreadsheet, CRM, or analytics platform, pulling this week's numbers, and passing them to the next step on a schedule. Tools like Google Sheets, Zapier, Make, and n8n are commonly used here because they don't require custom code and can run reliably in the background.
The AI layer handles the interpretive parts: comparing this week to last week, noticing that one metric moved outside its normal range, and turning a table of numbers into a few sentences a manager can read in thirty seconds.
The distinction matters because it defines what each part is trustworthy for. Automation is deterministic. It does exactly what it's configured to do, every time, but that doesn't mean it fails safely. A broken API key, a renamed spreadsheet, or a deleted column can just as easily fail silently, with no output and no error message, unless you build in a check for it. AI is probabilistic: it's good at summarizing and spotting patterns, but it can misread ambiguous data or state something with more confidence than the data supports. Treating AI output as a draft, not a final answer, is the difference between a reporting system that saves time and one that quietly damages trust in your numbers.
What Parts of a Weekly Report Can Be Automated?
Not every part of a report benefits equally from automation. Here's a realistic breakdown.
- Good candidates for full automation:
- Data collection: pulling numbers from a CRM, analytics tool, or spreadsheet on a schedule.
- Calculations: totals, averages, conversion rates, week-over-week percentage change.
- Comparisons: this week vs. last week, this month vs. last month, actual vs. target.
- Formatting: turning raw numbers into a consistent layout, table, or template.
- Delivery: sending the finished report to email, Slack, or a shared drive at the same time every week.
Good candidates for AI assistance, with human review:
- Trend detection: noticing that a metric has been declining for three consecutive weeks, not just this one.
- Anomaly detection: flagging a number that's unusually high or low compared to the recent pattern.
- Summaries: condensing ten rows of data into two or three readable sentences.
- Draft recommendations: suggesting possible next steps based on what the data shows.
Where human review is still important:
Anomaly flags need a person to confirm whether something is a real signal or a data entry error. Recommendations need a person who understands context the data doesn't capture. Maybe it's a marketing campaign that hasn't launched yet, or a client relationship that's strained. Maybe it's a tracking bug nobody's flagged yet. AI can draft the "why" and the "what to do," but it doesn't know what happened in the sales call that isn't in the CRM. That gap is exactly why validation and human review stay in the workflow rather than getting automated away.
How to Automate a Weekly Report With AI
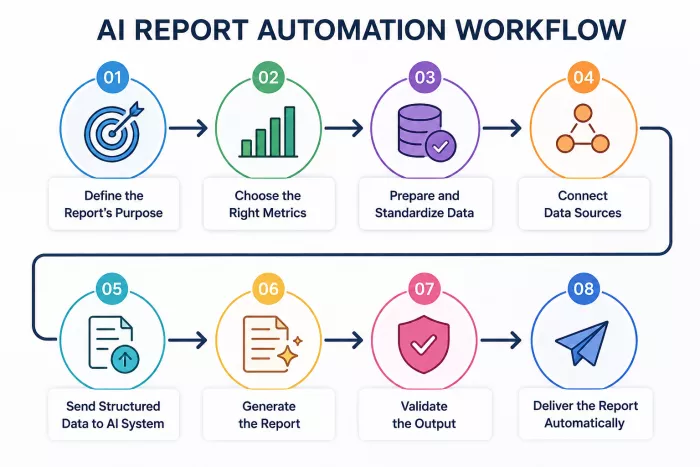
This is the practical sequence: Data → Data Preparation → Automation → AI Analysis → Report Generation → Validation → Human Review → Delivery.
Step 1: Define the report's purpose
Before connecting anything, write down who reads this report and what decision it helps them make. A report for a manager deciding where to spend budget looks different from one for a client who wants proof of progress. Skipping this is the biggest reason automated reports end up ignored: built around what's easy to pull, not what's useful to read.
What can go wrong: Without a clear purpose, it's tempting to include every available metric "just in case," producing a report that's technically automated but practically useless.
Step 2: Choose the right metrics
Pick the smallest set of numbers that actually answers the report's purpose. The right count varies by report and audience. A finance report and a social media snapshot won't need the same number of rows. The test is simpler than a fixed number: every metric you include should earn its place. Once the reader has to work to figure out what matters, you've added rows instead of clarity, which defeats the point of automating in the first place.
Step 3: Prepare and standardize data
Data preparation decides whether the rest of the workflow works. Date ranges need to line up, and naming needs to stay consistent too (don't let "Revenue" and "Total Sales" refer to the same thing across sources without reconciling it). Numbers and currency need one format throughout, and so do units.
Why it matters: AI systems analyze exactly what they're given. If two sources define "week" differently (Monday-start versus Sunday-start), the AI compares mismatched periods and produces a confidently wrong conclusion.
Step 4: Connect data sources
Connect the systems that hold your data (a CRM, analytics platform, support desk, or spreadsheet) to your automation tool. No-code platforms like Zapier, Make, and n8n can watch a spreadsheet for updates, pull CRM records on a schedule, or combine several sources before the AI step.
What can go wrong: Integrations break silently. An API key expires, or a spreadsheet gets renamed. Sometimes it's just a column that got deleted. Build in a check, even a simple one confirming the pulled data isn't empty, before the workflow continues.
Step 5: Send structured data to an AI system
Pass the cleaned, organized data to an AI system with clear instructions (see the prompt template below). Structured data, a table or clearly labeled rows, produces far more reliable output than a messy export. Do the arithmetic (totals, percentages, week-over-week change) before this step, in the spreadsheet or automation layer, and pass the results in already calculated. See the note on calculations below.
Step 6: Generate the report
The AI drafts the written portion: a summary of what happened, notable changes, and possible next steps, based only on the data provided.
Step 7: Validate the output
Check the draft against the original data source. Do the numbers match? Does the date range mentioned match the actual reporting period? This step exists because AI systems can occasionally state a plausible-sounding number that wasn't actually in the data - a failure mode sometimes called hallucination. Validation catches it before it reaches a reader.
Step 8: Deliver the report automatically
Once validated, the automation tool sends the report to its destination (email, Slack, or a shared document) on the same schedule every week. Consistency matters as much as accuracy; a report that arrives at a different time each week trains people to stop expecting it.
Throughout this sequence, the original data source remains the source of truth. The AI's job is to help interpret and communicate it, not to become the record of what happened.
Complete Example (Fictional Data)
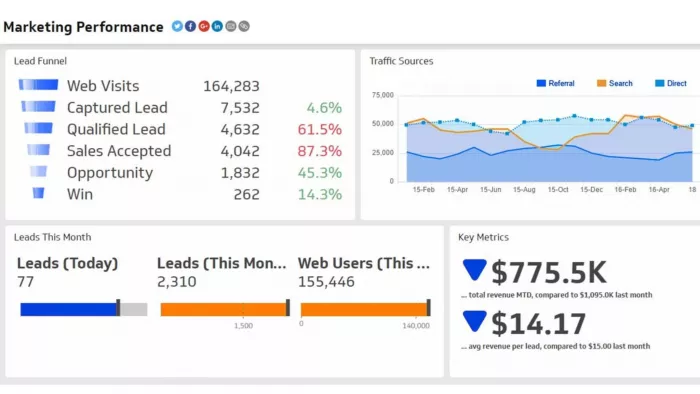
The following example uses fictional numbers to illustrate the full workflow. No real company, client, or result is being described.
Scenario: A small marketing team wants a weekly performance report pulled from their analytics platform and CRM. They want it summarized by AI and delivered to Slack every Monday morning.
Raw data (example, Week 12 vs. Week 11):
| Metric | Week 11 | Week 12 | Change |
| Website sessions | 4,210 | 5,140 | +22% |
| Leads generated | 68 | 71 | +4% |
| Cost per lead | $19.40 | $24.10 | +24% |
| Email open rate | 31% | 30% | -1 pt |
| Deals closed | 6 | 4 | -33% |
Workflow: Analytics and CRM data feed into a shared spreadsheet automatically, where the week-over-week changes shown above are calculated. An automation tool (such as Zapier or n8n) triggers every Monday at 6 a.m., pulls the updated spreadsheet rows (changes already included) and sends them to an AI system with the standardized prompt below. The AI-generated draft is posted to a private review channel first. A team member checks it against the spreadsheet, then approves it for delivery to the main Slack channel.
AI interpretation (example output):
Sessions rose 22% week-over-week, but leads only grew 4%, and cost per lead increased 24%. This suggests the traffic increase came from a lower-intent source - worth checking which channel drove the spike. Deals closed dropped from 6 to 4; with only one week of data, this could be normal variation rather than a trend. Recommend reviewing traffic source breakdown before increasing ad spend, and monitoring closed deals for a second week before treating the drop as a pattern.
Recommended action (human decision, informed by the draft): The marketing lead checks the traffic source report, confirms the spike came from a paid campaign the team already knew was running, and notes in the report that the cost-per-lead increase is expected and temporary. This is the kind of context the AI had no way to know, which is exactly why it's flagged as a recommendation to check, not stated as a conclusion.
This example shows the intended relationship: the AI identifies what's worth looking at and drafts language around it; a person supplies the missing context and makes the final call.
3 Ways to Automate Weekly Reports
There isn't one correct setup. The right approach depends on your data volume and technical comfort, plus how much the report needs to scale.
| Method | Difficulty | Best For | Flexibility | Maintenance | Scalability |
| Spreadsheet + AI | Low | Small teams, single data source, getting started | Low-Medium | Low | Limited - manual steps remain |
| No-code automation + AI (Zapier, Make, n8n) | Medium | Teams combining a few tools, non-developers | High | Medium | Good for most small-to-mid teams |
| API/workflow automation + AI | High | Multiple systems, high data volume, dev resources available | Very High | Higher (needs upkeep) | Best for scaling across many reports |
Spreadsheet + AI works well as a starting point: data lands in a spreadsheet, and an AI tool summarizes it on demand or on a light schedule. It's the fastest to set up and the easiest to understand, but someone still has to keep the spreadsheet updated unless it's connected to a live data source.
No-code automation + AI removes most manual data entry by connecting your tools directly. A CRM update triggers a spreadsheet update, which triggers an AI summary, which triggers a Slack message. This is the sweet spot for most small and mid-sized teams because it needs no custom code but still runs unattended.
API/workflow automation + AI is built with custom scripts or workflow engines calling APIs directly. It's more work to build and maintain, but it scales to high data volumes and multiple report types, with tighter control over formatting and error handling. That's the right investment once you're generating many reports, not just one.
Manual vs. Automated Weekly Reports
Before automating, it helps to see what actually changes, and what doesn't.
| Manual Reporting | Automated Reporting (Automation + AI) | |
| Time per report | 1–3 hours, depending on data source stability | Minutes of human review, once set up |
| Consistency | Varies by who writes it and how rushed they are | Same format and delivery time every week |
| Where errors creep in | Copy-paste mistakes, forgotten sources, inconsistent definitions | Silent integration failures, AI misreading ambiguous data; different failure types, not fewer of them |
| Scalability | Doesn't scale - each new report is more manual work | Scales well once the pipeline is built |
| Setup cost | Low to start, high ongoing time cost | Higher upfront (data prep, prompt design, testing), low ongoing time cost |
| Where judgment lives | Throughout - the writer interprets as they go | Front-loaded into setup and reserved for validation/review |
The honest takeaway: automation doesn't remove the need for human judgment, it relocates it, from "assembling the report" every week to "designing the workflow" once, with "reviewing the output" happening each week after that.
Types of Weekly Reports You Can Automate
Marketing reports track sessions, leads, cost per lead, and channel performance. Example: a summary noting organic traffic grew steadily while paid cost per lead rose over the past three weeks, flagged for a budget review.
SEO reports track rankings, organic sessions, indexed pages, and backlinks. Example: a report noting five target keywords moved up while two dropped out of the top 20, flagged as worth investigating rather than assuming a cause.
Sales reports track pipeline value, deals closed, average deal size, and win rate. Example: a summary noting pipeline value grew but win rate fell, prompting a check on whether lead quality changed.
Project management reports track completed tasks and overdue tasks, plus blockers. Example: a report flagging that overdue tasks doubled, concentrated in one workstream, for the project lead to investigate.
Customer support reports track ticket volume and response time, plus resolution rate. Example: a note that response time rose alongside a ticket spike. That's useful context, though staffing decisions stay with the support manager.
Social media reports track reach and engagement rate, plus follower growth. Example: a summary noting one post drove most of the week's engagement, worth reviewing for what made it perform differently.
Finance reports track spend against budget and burn rate, plus outstanding invoices. Example: a report flagging that one category is tracking 15% above budget pace, for finance to confirm before month-end.
Agency and client reporting combines several of the above into a client-facing summary. Example: a draft summarizing campaign performance in plain language, reviewed by the account manager before sending. Tone matters as much as accuracy here.
How to Prevent AI Reporting Errors
AI reporting errors are predictable enough to guard against systematically.
- Hallucinated numbers. The biggest risk. Instruct the AI to use only supplied data, and always validate output against the original source before sending.
- Incorrect calculations. Do totals, percentages, and averages in the automation or spreadsheet layer, not by asking the AI to compute them from raw numbers. It's more reliable interpreting numbers it's handed than calculating them precisely itself.
- Wrong date ranges. Standardize how "week" is defined across every connected tool, and state the exact range explicitly in every prompt.
- Missing data. Build a check into the automation step that flags an empty or incomplete pull before it reaches the AI, rather than letting a partial report go out silently.
- Duplicate records. Deduplicate at the preparation stage. An AI summarizing duplicated rows will overstate totals with no way to know they're duplicates.
- Unsupported conclusions. Instruct the AI to separate fact from interpretation, and to phrase uncertain causes as questions, not conclusions.
- Failed integrations. Monitor the workflow itself, not just the report. A silent failure that goes unnoticed for weeks is worse than one that's obvious immediately.
- Outdated data. Confirm the trigger runs after source data has fully updated for the period - a report generated too early summarizes an incomplete week.
The underlying principle worth repeating: the original data source stays the source of truth. AI helps interpret and communicate what's already validated. It isn't the record of what happened.
When You Should NOT Automate a Weekly Report
Automation isn't the right call in every situation, and knowing when to hold off is part of doing this well.
- Unreliable data. If the underlying data is inconsistent or frequently corrected after the fact, automating on top of it just produces confidently wrong reports faster.
- Constantly changing report requirements. If stakeholders change what they want tracked every few weeks, a rigid automated workflow needs constant rebuilding. Stabilize the format manually first.
- Highly subjective analysis. Judgment calls aren't well suited to AI-drafted summaries, since the AI has no access to that context. That includes evaluating creative quality, reading team morale, or assessing a client relationship.
- Reports requiring significant strategic judgment. A report justifying a major budget shift or pivot deserves direct human analysis, with data as input rather than the report writing itself.
- Unclear reporting goals. If nobody can articulate what decision the report supports, automating it just locks in a report nobody was sure they needed.
In these cases, a lighter-weight manual process is often better until the data or requirements stabilize enough to automate reliably.
Common Mistakes When Automating Weekly Reports
Tracking too many metrics. More data isn't more useful if nobody reads past the fifth row. Cut to what supports a decision.
Inconsistent data. Mismatched naming, date ranges, or formats between sources undermines everything built on top of them.
Vague AI instructions. "Summarize this data" produces a generic, low-value draft. Specific instructions, like the prompt template above, produce specific, checkable output.
Skipping validation. This is the step most likely to get cut under time pressure, and the one that catches errors before a reader sees them. Don't skip it.
Automating before defining the report. Building the pipeline before deciding what it needs to say just means rebuilding it later.
Failing to monitor workflow errors. A report that fails silently is worse than one that's late. Nobody notices until someone asks where last week's went.
Producing reports nobody uses. Check in periodically. If a report has run for months and nobody references it in decisions, cut it rather than maintain it out of habit.
How to Measure Success
Once a report has been running for a few weeks, it's worth checking whether the automation is actually working - not just whether it's running.
- Time actually saved. Compare the time spent reviewing the draft each week against the time the old manual process took. If review takes nearly as long as writing did, the workflow needs tightening, not more automation on top.
- Validation catch rate. Track how often the human review step finds an error - wrong numbers, mismatched date ranges, unsupported claims. A high catch rate that isn't dropping over time signals a data or prompt problem upstream, not just a review step doing its job.
- Workflow reliability. Track failed or incomplete runs, not just successful ones. A pipeline that silently skips a week is a bigger risk than one that's occasionally late but visibly so.
- Whether it's read and used. Ask periodically whether the report has actually informed a decision recently. A report nobody references is a maintenance cost, not a time saver, however reliably it's delivered.
- Trust over time. Watch whether recipients start double-checking the numbers themselves. That's usually an early signal that validation has been slipping, even before an obvious error shows up.
None of these need to be tracked with heavy tooling. A short note each month is usually enough to catch drift before it becomes a bigger problem.
How often should I review an automated reporting workflow? Check it whenever a connected tool changes, since that's the most common cause of silent failures. A quarterly review of whether the report is still useful is enough for most teams.
Conclusion
Weekly reporting doesn't have to mean spending hours collecting numbers, checking spreadsheets, and rewriting the same type of summary every week. When automation and AI are used together, the repetitive work can happen in the background while your team focuses on understanding the results and deciding what to do next.
The key is to build the workflow around reliable data and clear boundaries. Let automation handle data collection, calculations, and scheduling. Let AI help identify important changes and turn validated numbers into a useful summary. Then keep a human review step before the report is shared, especially when the results could influence budgets, priorities, or other important decisions.
You don't need to automate every report at once. Start with one weekly report, one reliable data source, and a few metrics that genuinely matter. Once that workflow is accurate, consistent, and trusted, you can expand it to more reports and more teams.
The goal isn't to remove people from reporting. It's to remove the repetitive work around reporting so people can spend more time acting on the information instead of assembling it.
Comments